Introduction
Analec is a freeware, multiplatform tool (it runs with all main OS, Windows, iOS, …) for carrying out linguistic annotation of textual data.
Analec uses a Java environment. Click here to download Java.
Getting started
Download Analec from here and install it.
Click on the “Documents” menu, then choose “Ouvrir” to open the corpus and select the .ec file.
Visualization of the corpus
1. Markers and scope portions
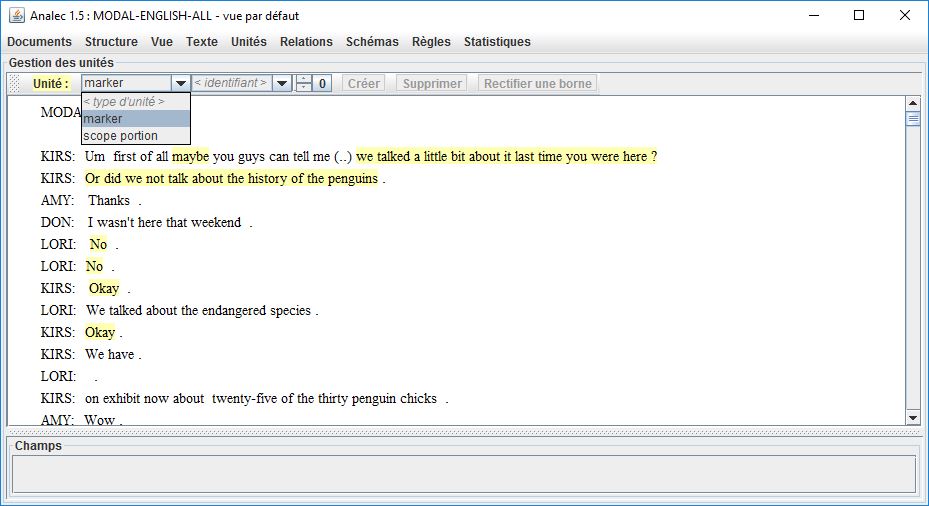
You will now be directed to the “Gestion des unités” interface.
- Click on “type d’unité” and choose between “marker” and “scope portion” to display the elements in the text (highlighted in yellow);
- Click on the element to check the values assigned to each unit.
You can also search for a specific item in the text by clicking on “identifiant” and scroll the results with the up-down arrows next to “identifiant”.
This interface is also available from the “Unités” menu → “Gestion des unites”.
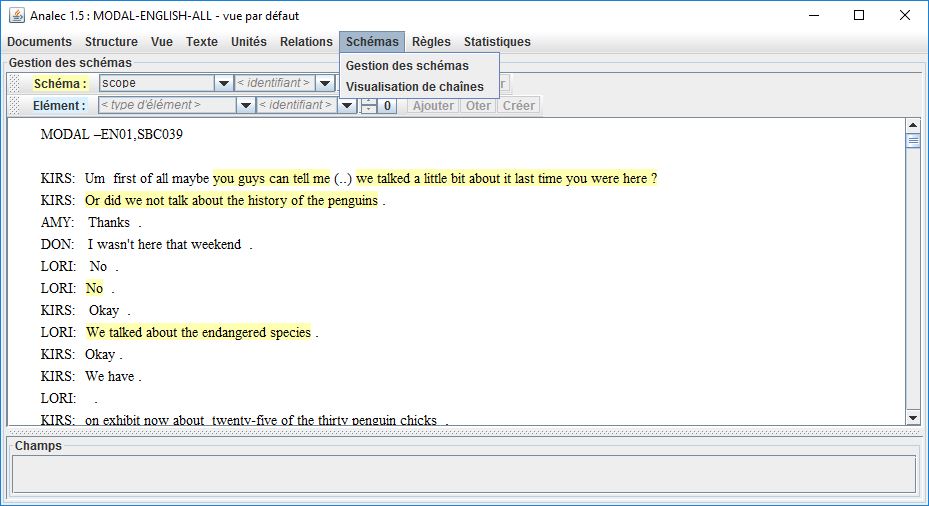
2. Scopes
To view the scopes, i.e. the combinations of two or more scope portions:
- Click on the “Schémas” menu;
- Click on “Gestions des schémas”;
- Select “scope” as “type de schéma”.
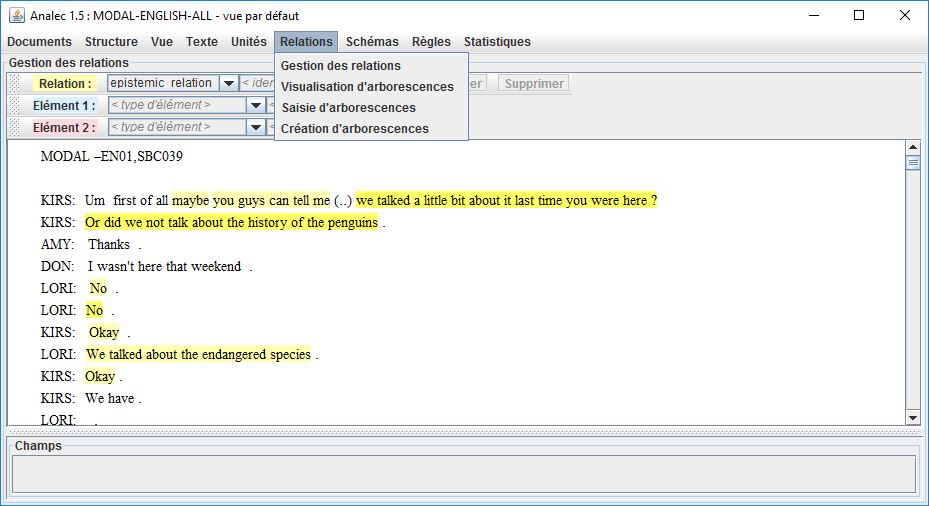
3. Relations
To view the relations between the markers and the scopes (in the form of “SCH-scope”):
- Click on the “Relations” menu;
- Click on “Gestion des relations”;
- Select “epistemic relation” as “type de relation”.
Searching the corpus
1. Customization of the vue
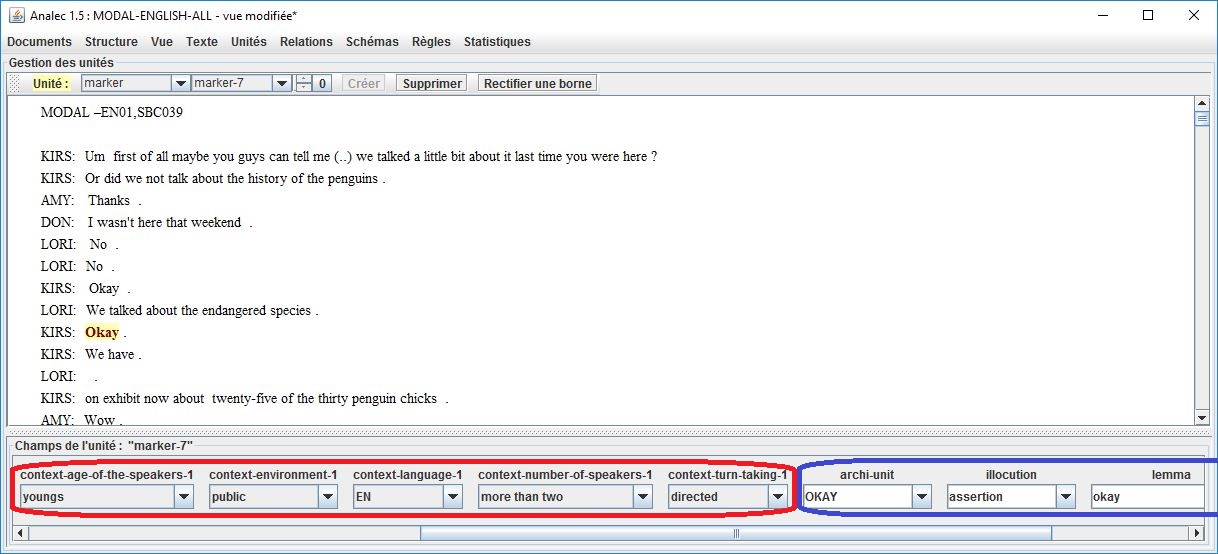
The default view of the annotated text shows you the properties and values assigned to each annotated element (e.g. the item ‘okay’) in the way they are defined in the annotation scheme.
By clicking on the “Vue” menu → “Gestion de la vue”, you can customize this default interface by adding to an element type some properties and values assigned to other element types that are directly linked to it via the epistemic relation.
Note that this element type can coincide with the epistemic relation itself.
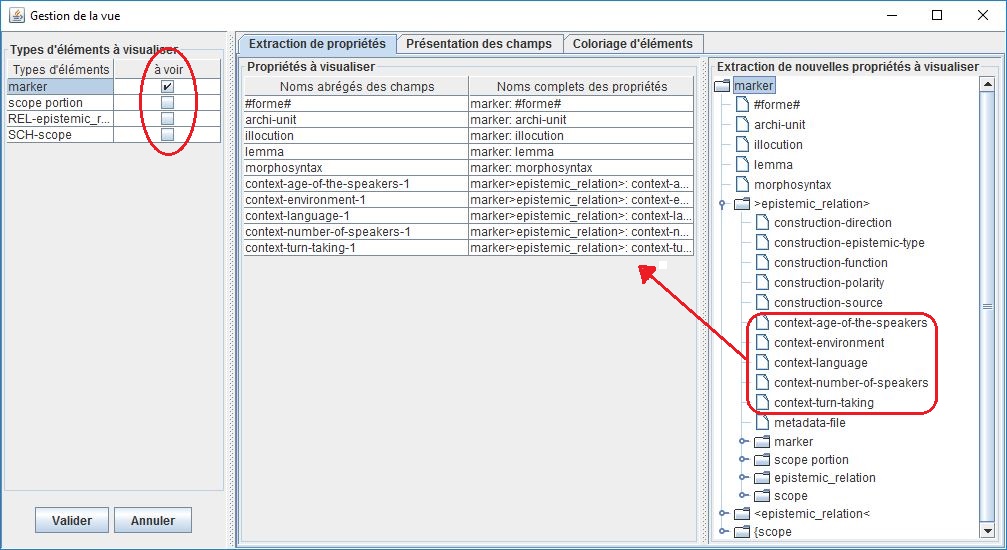
On the left column you can select the element types you want to take into account (e.g. the ‘marker’ type that includes ‘okay’).
On the right column you can choose, by double-clicking, the new properties that will be transferred to the element type and displayed in the main interface (e.g. the five contextual properties of the epistemic relation in which ‘okay’ is embedded).
In the middle part of the screen these new properties are displayed.
Save this customization by clicking on “Valider” on the bottom left corner.
Now for each item included in the element type both the default properties (here circled in blue) and the new ones (in red) are displayed.
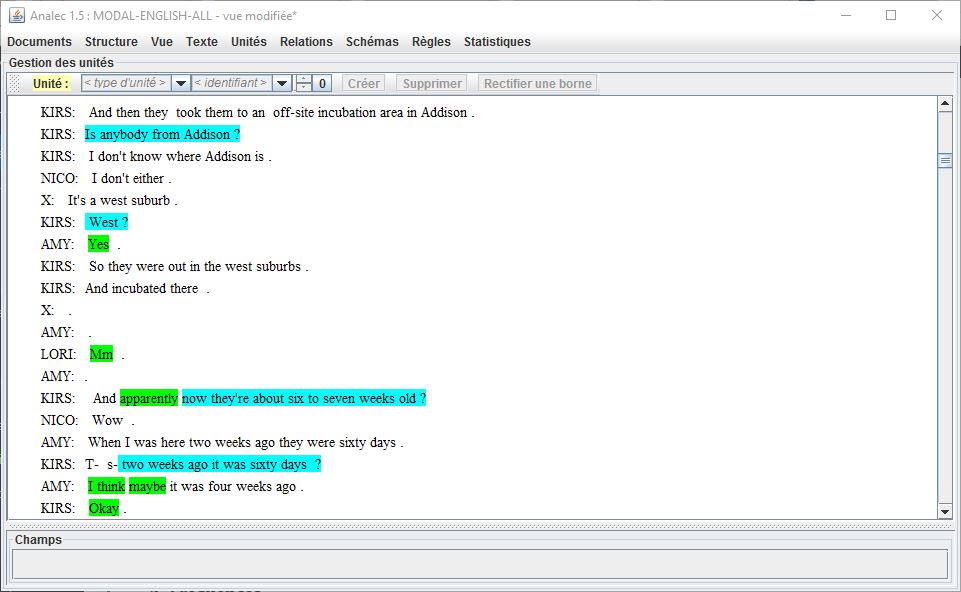
With this tool is also possible to change the way the annotated elements are presented in the text (different colors, font, highlight).
To do so, select “Coloriage d’éléments” in the middle section of the screen.
The view in the screenshot below shows the illocutionary force (assertive in green, interrogative in blue) associated with each epistemic marker.
You can pursue statistical analysis of the corpus by means of three tools available in Analec.
To access to these tools:
- Click on the “Statistiques” menu;
- Choose between “Fréquences”, “Corrélations” and “Représentations géometriques”.
2. Frequences
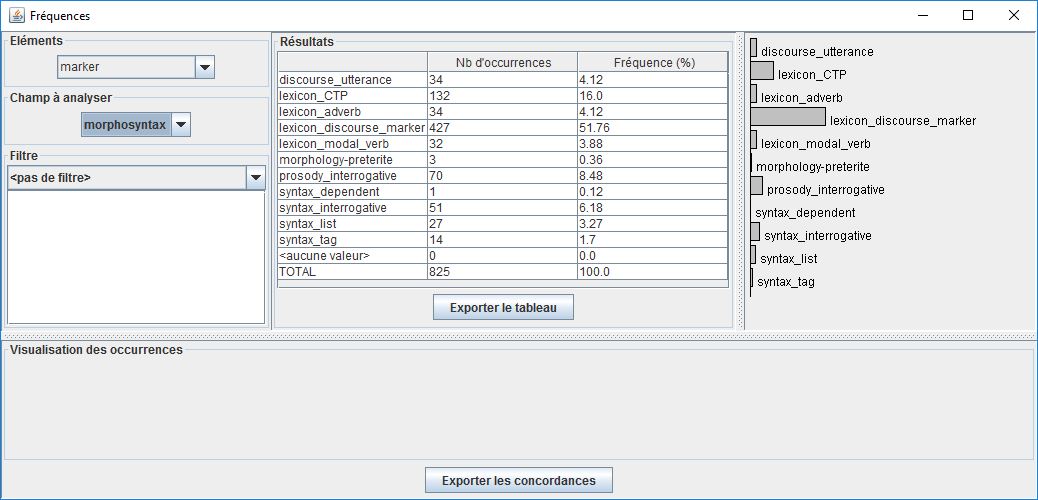
“Fréquences” is a tool for quantitative analysis of the units.
Choose the element type (“Elément”) and the field you want to analyze (“Champ à analyser”), as in the screenshot below.
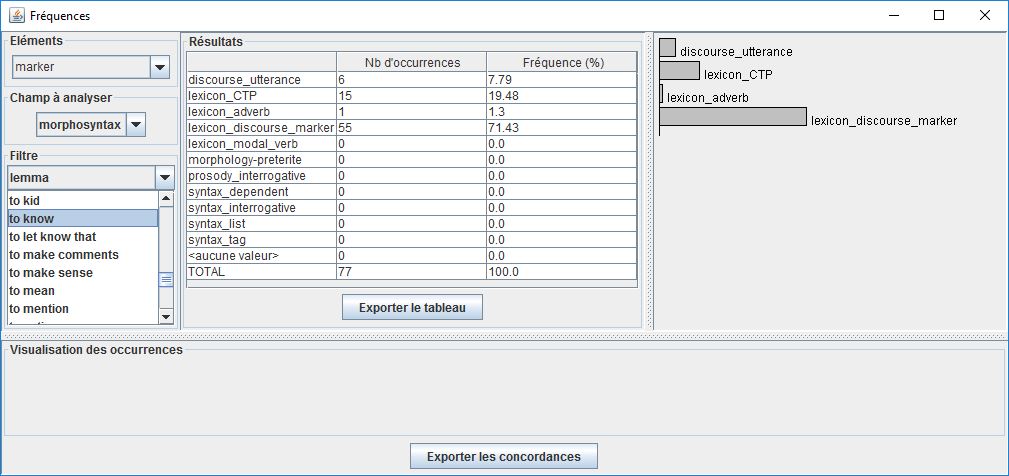
You can filter your search results by selecting a specific property and value associated with the element type in the “Filtre” menu, like in the example below.
It is also possible to export the table by clicking on “Exporter le tableau” and the occurrences by clicking on “Exporter les concordances” (both will be saved in a plain text format).
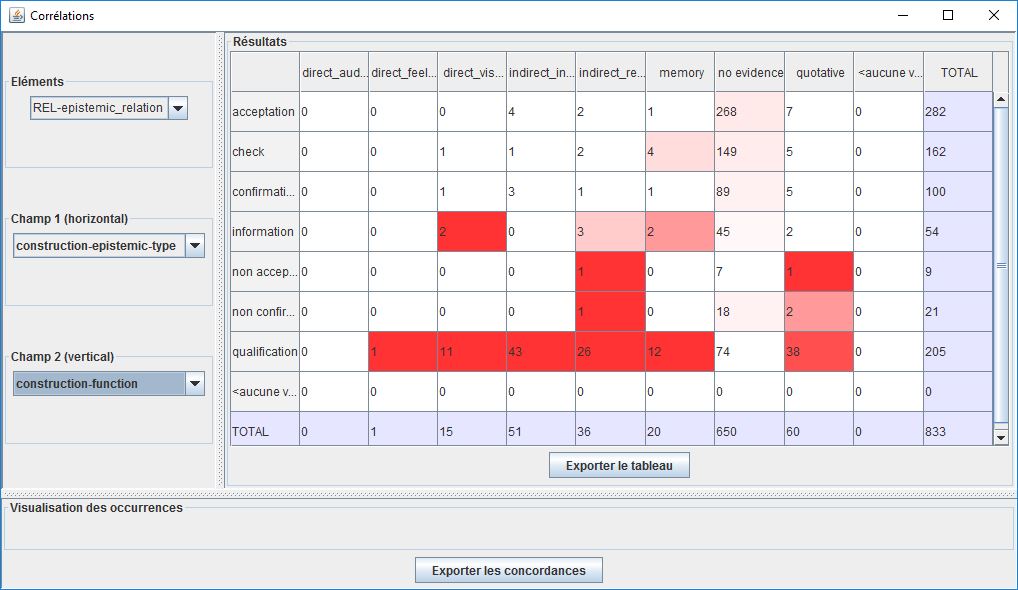
3. Correlations
The “corrélations” tool allows you to detect significant correlations between properties, calculated through a chi-squared test.
- Select the element type of which you want to see the properties in correlation by clicking on the “Eléments” menu;
- Choose the properties whose values you want to be displayed in the table horizontally (“Champ 1”) and vertically (“Champ 2”).The most significant correlations are highlighted in dark red, the moderately and mildly significant ones in rose and faded rose, as shown in the example below.
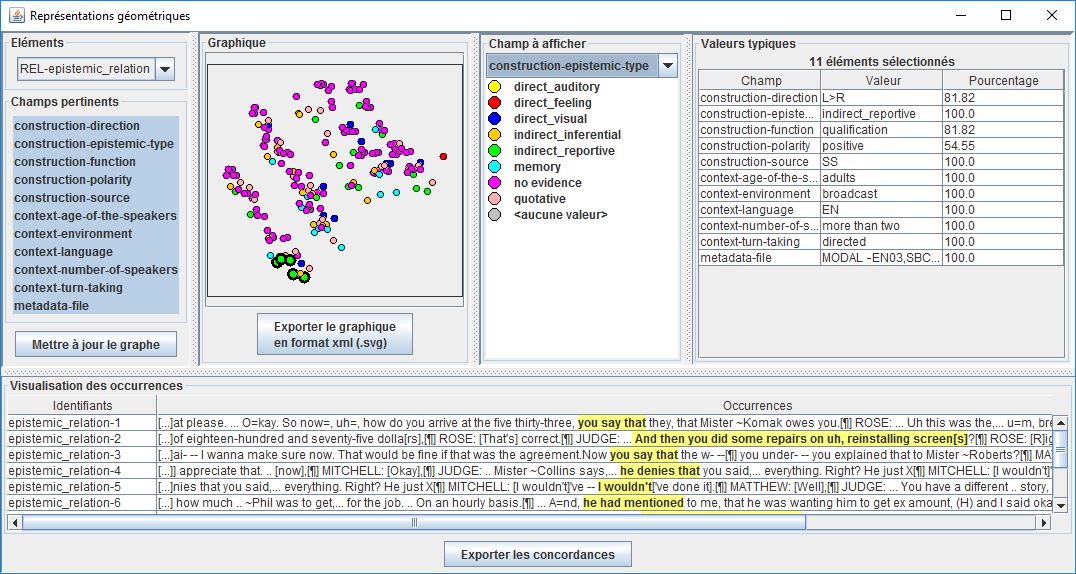
4. Geometric representations
The “Représentations géometriques” tool allows you to carry out factorial analysis of correspondence via geometric representations in the shape of point clouds.
This kind of representation allows to show clusters of items with the same properties, i.e. natural classes of markers or modal constructions.
- Choose the element type (“Elément”);
- Select the set of properties you want to see represented (“Champs pertinents”). To update the graph at this point, click on “Mettre à jour le graphe”;
- Select the specific property you want to see displayed in different colors (“Champ à afficher”);
- Click on points in the graph to show the related occurrences and statistical values.
Valerio Cervoni